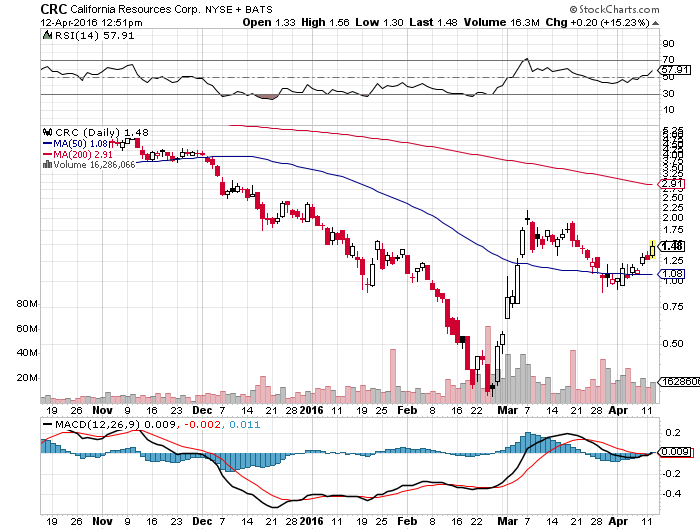
| Composite Indicators | Signal | ||||||||||
| Buy | |||||||||||
| Short Term Indicators | |||||||||||
| Buy | |||||||||||
| Buy | |||||||||||
| Buy | |||||||||||
| Buy | |||||||||||
| Hold | |||||||||||
| Short Term Indicators Average: 80% Buy | |||||||||||
| 20-Day Average Volume – 18,995,703 | |||||||||||
| Medium Term Indicators | |||||||||||
| Hold | |||||||||||
| Buy | |||||||||||
| Sell | |||||||||||
| Buy | |||||||||||
| Medium Term Indicators Average: 25% Buy | |||||||||||
| 50-Day Average Volume – 19,247,926 | |||||||||||
| Long Term Indicators | |||||||||||
| Hold | |||||||||||
| Sell | |||||||||||
| Sell | |||||||||||
| Long Term Indicators Average: 67% Sell | |||||||||||
| 100-Day Average Volume – 14,254,258 | |||||||||||
| Overall Average: 32% Buy | |||||||||||
|
|||||||||||
| Click on the indicator for a graphical interpretation, or visit the Education Center for information on the studies. | |||||||||||

Sources: Barchart, Risers and fallers, yahoo finance
Broad Street Alerts has not been compensated for this report and we do not hold any positions in CRC.