See feature report below: (Nasdaq: CROX)
About Broad Street Alerts:
Big opportunities in Small Cap’s
Broad Street Alerts recent profiles and track record, 153% in verifiable potential gains for our members on the last 3 small cap alerts alone!
February 10th, 2016- (NASDAQ: BONT) opened $1.65/share hit a high of $3.00/share within 30 days our member potential gains- 83%
March 7th, 2016-(NYSE-MKT: FSI) opened at .91/share and hit 1.10/share within 5 days for gains of 21% for our members.
March 24th, 2016- (NASDAQ: ICLD) opened at $.77/share it a high of $1.15/share within 2 days for gains of 49% for our members.
These are numbers that make traders drool. Any trader in any market would fall all over themselves to see numbers like this. So if you’ve been on the fence, perhaps it’s time to start doing some research and verify our numbers for yourself. We are constantly raising the bar and separate ourselves from the rest of the small-cap newsletters as the best in business.
We know with a large following comes a large responsibility as we have everyone from institutional investors to the beginner following our profiled securities in our newsletters. This is something we take very seriously always seeking small cap growth companies that have both near and long-term potential for our members.
***Get our small cap profiles, special situation and watch alerts in real time. We are now offering our VIP SMS/text alert service for free, simply text the word “Alerts” to the phone number 25827 from your cell phone.
Article (Nasdaq: CROX)
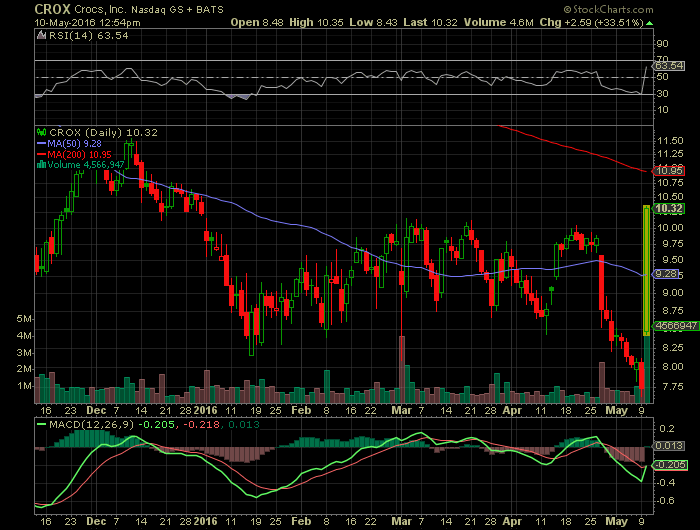
Crocs (NASDAQ:CROX), maker of casual lifestyle footwear, Tuesday reported strong results for Q1 2016 and announced its financial targets for Q2. Net income was $6.4 million, or $0.07 per diluted share, compared to a net loss of $6 million, or $0.08 per diluted share, exceeding the Capital IQ consensus of $0.06. Revenues grew year-over-year to $279.1 million from $262.2 million.
The mean estimate for revenues were $266.5 million. For Q2, the company expects revenue in the $340 million to $350 million range. The Street is at $358 million. The stock was moving Monday after hours, at the lower half of 52-week range $7.63 – $16.05.
The stock is up 9.18% or $0.71 after the news, hitting $8.44 per share. About 325 shares traded hands. Crocs, Inc. (NASDAQ:CROX) has declined 31.89% since October 2, 2015 and is downtrending. It has underperformed by 37.39% the S&P500.
Crocs, Inc., together with its subsidiaries, designs, develops, manufactures, markets, and distributes casual lifestyle footwear and accessories for men, women, and children worldwide. It offers various footwear products, including clogs, sandals, wedges, flats, sneakers, and boots.
The companyÂ’s primary trademarks include the Crocs logo and the Crocs word mark. It sells its products in approximately 65 countries through domestic and international retailers and distributors, as well as directly to end-user consumers through company-operated retail stores, outlets, Webstores, and kiosks. As of December 31, 2015, Crocs, Inc. operated 275 retail stores; 98 kiosks and store-in-stores; 186 outlet stores; and 12 company-operated e-commerce Web stores. The company was founded in 1999 and is headquartered in Niwot, Colorado.
Earnings Report:
Crocs, Inc. Reports First Quarter 2016 Financial Results
Revenue Increased 6.5% to $279.1 Million
NIWOT, Colo., May 10, 2016 (GLOBE NEWSWIRE) — Crocs, Inc. (NASDAQ:CROX) today reported financial results for the three months ended March 31, 2016.
First Quarter Highlights:
Revenue increased 6.5% to $279.1 million. On a constant currency basis, revenue increased 9.2% compared to the first quarter of 2015.
Net income attributable to common stockholders on a GAAP basis was $6.4 million or $0.07 per diluted share.
Gregg Ribatt, Chief Executive Officer, said: “We are pleased with our start to the new year. First quarter revenue increased 6.5% driven by the positive response to our spring/summer 2016 line and operational improvements. While operational supply chain improvements resulted in some favorable timing of wholesale shipments in the quarter compared to our initial expectations, the strong growth in our e-commerce business and positive retail comps in all regions demonstrates the meaningful progress we have made in repositioning the Crocs brand and business over the past 21 months. There is still work to be done to position the company for sustained success; however, we remain confident that we are on track to deliver our full year and future sales and profit objectives.”
First Quarter Operating Results
In the first quarter of 2016, the company reported GAAP net income attributable to common stockholders of $6.4 million or $0.07 per share, compared with a net loss attributable to common stockholders of $6.0 million or ($0.08) per share in the same quarter of the prior year.
As outlined in detail in the non-GAAP reconciliations set forth later in this press release, the company recorded net charges of $0.1 million not related to our core business in the first quarter of 2016 compared with $10.7 million in the first quarter of 2015. Excluding these items, the company reported on a comparable basis, non-GAAP adjusted net income attributable to common shareholders of $6.4 million in the first quarter of 2016 versus non-GAAP adjusted net income attributable to common shareholders of $4.7 million in the first quarter of 2015.
For the quarter ended March 31, 2016 we had 74.0 million diluted shares outstanding and 73.1 million weighted average common shares outstanding. The company did not repurchase any shares during the three months ended March 31, 2016.
Balance Sheet
Cash and cash equivalents as of March 31, 2016 were $89.1 million compared with $143.3 million at December 31, 2015. The decrease in cash and cash equivalents was primarily attributable to the seasonal increase in our net working capital as we build inventories and accounts receivable for our spring/summer 2016 selling season. Inventory was $186.1 million at March 31, 2016 compared to $168.2 million at December 31, 2015.
Financial Outlook
The company expects second quarter 2016 revenue in the $340 to $350 million range compared to $345.7 million in the second quarter of last year. This guidance reflects the timing impact from earlier shipments in the first quarter, as noted above. Additionally, revenue growth is anticipated to be in the mid-single digits, on a constant currency basis, in the first half of the year compared to the first half of 2015.
Conference Call Information
A teleconference call to discuss first quarter 2016 results is scheduled for today, Tuesday, May 10, 2016, at 8:30 am EDT. The call participation number is (888) 771-4371. A recording of the conference call will be available two hours after the completion of the call at (888) 843-7419. International participants can dial (847) 585-4405 to take part in the conference call and can access a replay of the call at (630) 652-3042. All of the above calls will require the input of the conference identification number 42377507. The call also will be streamed on the Crocs website, www.crocs.com. An audio recording of the conference call will be available at www.crocs.com through May 10, 2017.
About Crocs, Inc.
Crocs, Inc. is a world leader in innovative casual footwear for men, women, and children. Crocs offers a broad portfolio of all-season products, while remaining true to its core molded footwear heritage. All Crocs™ shoes feature Croslite™ material, a proprietary, revolutionary technology that gives each pair of shoes the soft, comfortable, lightweight, non-marking and odor-resistant qualities that Crocs fans know and love. Crocs celebrates the fun of being a little different and encourages fans to “Find Your Fun” in every colorful pair of shoes. Since its inception in 2002, Crocs has sold more than 300 million pairs of shoes in more than 65 countries around the world.
Visit www.crocs.com for additional information.
The matters regarding the future discussed in this news release include “forward-looking statements” within the meaning of the Private Securities Litigation Reform Act of 1995. These statements include, but are not limited to, statements regarding prospects, investments in our business and outlook. These statements involve known and unknown risks, uncertainties and other factors, which may cause our actual results, performance or achievements to be materially different from any future results, performances, or achievements expressed or implied by the forward-looking statements. These risks and uncertainties include, but are not limited to, the following: macroeconomic issues, including, but not limited to, the current global financial conditions; the effect of competition in our industry; our ability to effectively manage our future growth or declines in revenue; changing fashion trends; our ability to maintain and expand revenues and gross margin; our ability to accurately forecast consumer demand for our products; our ability to successfully implement our strategic plans; our ability to develop and sell new products; our ability to obtain and protect intellectual property rights; the effect of potential adverse currency exchange rate fluctuations and other international operating risks; and other factors described in our most recent annual report on Form 10-K under the heading “Risk Factors” and our subsequent filings with the Securities and Exchange Commission. Readers are encouraged to review that section and all other disclosures appearing in our filings with the Securities and Exchange Commission.
All information in this document speaks as of May 10, 2016. We do not undertake any obligation to update publicly any forward-looking statements, including, without limitation, any estimate regarding revenues or earnings, whether as a result of the receipt of new information, future events, or otherwise.
CROCS, INC. AND SUBSIDIARIES
CONSOLIDATED STATEMENTS OF OPERATIONS (UNAUDITED)
($ thousands, except per share data)
Three Months Ended
March 31,
2016 2015
Revenues $ 279,140 $ 262,193
Cost of sales 149,774 134,823
Gross profit 129,366 127,370
Selling, general and administrative expenses 114,930 126,069
Asset impairment charges 193 —
Restructuring charges — 3,663
Income (loss) from operations 14,243 (2,362 )
Foreign currency transaction gain (loss), net (1,247 ) 494
Interest income 216 288
Interest expense (243 ) (219 )
Other income (expense), net 82 (331 )
Income (loss) before income taxes 13,051 (2,130 )
Income tax expense (2,905 ) (295 )
Net income (loss) $ 10,146 $ (2,425 )
Dividends on Series A convertible preferred stock $ (3,000 ) $ (2,833 )
Dividend equivalents on Series A convertible preferred shares related to redemption value accretion and beneficial conversion feature (785 ) (721 )
Net income (loss) attributable to common stockholders $ 6,361 $ (5,979 )
Net income (loss) per common share:
Basic $ 0.07 $ (0.08 )
Diluted $ 0.07 $ (0.08 )
CROCS, INC. AND SUBSIDIARIES
RECONCILIATION OF GAAP MEASURES TO NON-GAAP MEASURES
(UNAUDITED)
In addition to financial measures presented on the basis of accounting principles generally accepted in the United States of America (“U.S. GAAP”), we present “Non-GAAP selling, general, and administrative expenses”, “Non-GAAP cost of sales”, and “Non-GAAP adjusted net income (loss) attributable to common stockholders”, which are non-GAAP financial measures. Adjusted results exclude the impact of items that management believes affect the comparability or underlying business trends in our consolidated financial statements in the periods presented.
We also present certain information related to our current period results of operations through “constant currency”, which is a non-GAAP financial measure and should be viewed as a supplement to our results of operations and presentation of reportable segments under U.S. GAAP. Constant currency represents current period results that have been restated using prior year average foreign exchange rates for the comparative period to enhance the visibility of the underlying business trends excluding the impact of foreign currency exchange rate fluctuations.
Management uses adjusted results to assist in comparing business trends from period to period on a consistent non-GAAP basis in communications with the Board, stockholders, analysts, and investors concerning our financial performance. We believe that these non-GAAP measures are useful to investors and other users of our consolidated financial statements as an additional tool for evaluating operating performance. We believe they also provide a useful baseline for analyzing trends in our operations. Investors should not consider these non-GAAP measures in isolation from, or as a substitute for, financial information prepared in accordance with U.S. GAAP.
CROCS, INC. AND SUBSIDIARIES
RECONCILIATION OF GAAP MEASURES TO NON-GAAP MEASURES
(UNAUDITED)
Three Months Ended March 31,
2016 2015
(in thousands)
Selling, general and administrative expenses reconciliation:
GAAP selling, general and administrative expenses $ 114,930 $ 126,069
Reorganization charges (1) (184 ) (1,399 )
Customs audit settlements (2) (354 ) —
ERP implementation (3) — (5,648 )
Total selling, general and administrative adjustments (538 ) (7,047 )
Non-GAAP selling, general and administrative expenses $ 114,392 $ 119,022
Three Months Ended March 31,
2016 2015
(in thousands)
Cost of sales reconciliation:
GAAP cost of sales: $ 149,774 $ 134,823
Favorable settlement of customs audit (4) 650 —
Non-GAAP cost of sales $ 150,424 $ 134,823
Three Months Ended March 31,
2016 2015
(in thousands)
Net loss attributable to common stockholders reconciliation:
GAAP net income (loss) attributable to common stockholders reconciliation: $ 6,361 $ (5,979 )
Favorable settlement of customs audit (4) (650 ) —
Reorganization charges (1) 377 1,399
Customs audit settlements (2) 354 —
ERP implementation (3) — 5,648
Restructuring charges (5) — 3,663
Total adjustments 81 10,710
Non-GAAP adjusted net income attributable to common stockholders $ 6,442 $ 4,731
_____________________
(1) Relates to severance expenses, bonuses, store closure costs, consulting fees, and other expenses related to recent reorganization activities.
(2) Represents penalties and fees related to the settlement of the customs audit.
(3) Represents operating expenses related to the implementation of our new ERP system.
(4) Represents the release of the reserve due to favorable settlement terms of the customs audit.
(5) Represents severance, lease and other contract exit costs, and other expenses associated with the restructuring plan that concluded in December 2015.
CROCS, INC. AND SUBSIDIARIES
CONSOLIDATED BALANCE SHEETS
($ thousands, except number of shares)
March 31, December 31,
2016 2015
ASSETS
Current assets:
Cash and cash equivalents $ 89,080 $ 143,341
Accounts receivable, net of allowances of $52,254 and $49,364, respectively 157,159 83,616
Inventories 186,113 168,192
Income tax receivable 10,001 10,233
Other receivables 16,925 14,233
Prepaid expenses and other assets 35,477 26,334
Total current assets 494,755 445,949
Property and equipment, net 50,047 49,490
Intangible assets, net 79,651 82,297
Goodwill 2,611 1,973
Deferred tax assets, net 6,746 6,608
Other assets 21,676 21,703
Total assets $ 655,486 $ 608,020
LIABILITIES AND STOCKHOLDERS’ EQUITY
Current liabilities:
Accounts payable $ 83,331 $ 63,336
Accrued expenses and other liabilities 96,265 92,573
Income taxes payable 7,682 6,416
Current portion of long-term borrowings and capital lease obligations 12,658 4,772
Total current liabilities 199,936 167,097
Long-term income tax payable 4,684 4,547
Long-term borrowings and capital lease obligations 901 1,627
Other liabilities 13,623 13,120
Total liabilities 219,144 186,391
Commitments and contingencies
Series A convertible preferred stock, par value $0.001 per share, 1,000,000 shares authorized, 200,000 shares issued and outstanding, redemption amount and liquidation preference of $203,000 and $203,000 as of March 31, 2016 and December 31, 2015, respectively 176,442 175,657
Stockholders’ equity:
Preferred stock, par value $0.001 per share, 4,000,000 shares authorized, none outstanding — —
Common stock, par value $0.001 per share, 250,000,000 shares authorized, 93,576,893 and 73,298,471 shares issued and outstanding, respectively, as of March 31, 2016 and 93,101,007 and 72,851,418 shares issued and outstanding, respectively, as of December 31, 2015 94 94
Treasury stock, at cost, 20,278,422 and 20,249,589 shares as of March 31, 2016 and December 31, 2015, respectively (284,176 ) (283,913 )
Additional paid-in capital 356,271 353,241
Retained earnings 233,824 227,463
Accumulated other comprehensive loss (46,113 ) (50,913 )
Total stockholders’ equity 259,900 245,972
Total liabilities, commitments and contingencies and stockholders’ equity $ 655,486 $ 608,020
The following tables summarize our total revenue by channel for the three months ended March 31, 2016 and 2015:
Three Months Ended March 31, Change Constant Currency Change (1)
2016 2015 $ % $ %
(in thousands)
Wholesale:
Americas $ 74,155 $ 61,176 $ 12,979 21.2 % $ 15,104 24.7 %
Asia Pacific 77,154 72,497 4,657 6.4 % 6,659 9.2 %
Europe 39,062 44,653 (5,591 ) (12.5 )% (4,611 ) (10.3 )%
Other businesses 172 225 (53 ) (23.6 )% (52 ) (23.1 )%
Total wholesale 190,543 178,551 11,992 6.7 % 17,100 9.6 %
Retail:
Americas 35,749 34,617 1,132 3.3 % 1,238 3.6 %
Asia Pacific 22,519 23,345 (826 ) (3.5 )% 145 0.6 %
Europe 7,555 8,411 (856 ) (10.2 )% (336 ) (4.0 )%
Total retail 65,823 66,373 (550 ) (0.8 )% 1,047 1.6 %
E-commerce:
Americas 14,226 9,976 4,250 42.6 % 4,335 43.5 %
Asia Pacific 4,829 3,933 896 22.8 % 1,074 27.3 %
Europe 3,719 3,360 359 10.7 % 507 15.1 %
Total e-commerce 22,774 17,269 5,505 31.9 % 5,916 34.3 %
Total revenues $ 279,140 $ 262,193 $ 16,947 6.5 % $ 24,063 9.2 %
Revenues:
Americas $ 124,130 $ 105,769 $ 18,361 17.4 % $ 20,677 19.5 %
Asia Pacific 104,502 99,775 4,727 4.7 % 7,878 7.9 %
Europe 50,336 56,424 (6,088 ) (10.8 )% (4,440 ) (7.9 )%
Total segment revenues 278,968 261,968 17,000 6.5 % 24,115 9.2 %
Other businesses 172 225 (53 ) (23.6 )% (52 ) (23.1 )%
Total consolidated revenues $ 279,140 $ 262,193 $ 16,947 6.5 % $ 24,063 9.2 %
_______________________
(1) Reflects year over year change as if the current period results were in “constant currency,” which is a non-GAAP financial measure. See “Use of Non-GAAP Financial Measures” above for more information.
CROCS, INC. SUBSIDIARIES
RETAIL STORE COUNTS
(UNAUDITED)
December 31,
2015 Opened Closed March 31,
2016
Company-operated retail locations
Type
Kiosk/store in store 98 2 3 97
Retail stores 275 1 11 265
Outlet stores 186 3 1 188
Total 559 6 15 550
Operating segment
Americas 196 1 1 196
Asia Pacific 261 5 12 254
Europe 102 — (1 ) 2 100
Total 559 6 15 550
________________________
(1) Excludes eight retail locations acquired in Austria on March 31, 2016 as no revenue was
recognized associated with those locations in the three months ended March 31, 2016.
CROCS, INC. AND SUBSIDIARIES
COMPARABLE STORE SALES
RETAIL AND DIRECT TO CONSUMER
(UNAUDITED)
Constant Currency (2) Constant Currency (2)
Three Months Ended Three Months Ended
March 31, 2016 March 31, 2015
Comparable store sales (retail only) (1)
Americas 2.9 % (5.8 )%
Asia Pacific 2.0 % (9.4 )%
Europe 7.5 % 5.7 %
Global 3.1 % (5.3 )%
Constant Currency (2) Constant Currency (2)
Three Months Ended Three Months Ended
March 31, 2016 March 31, 2015
Direct to Consumer comparable store sales (includes retail and e-commerce) (1)
Americas 12.2 % (4.3 )%
Asia Pacific 5.8 % (5.8 )%
Europe 9.7 % 2.1 %
Global 9.9 % (3.7 )%
______________________
(1) Comparable store status is determined on a monthly basis. Comparable store sales begin in the thirteenth month of a store’s operation. Stores in which selling square footage has changed more than 15% as a result of a remodel, expansion, or reduction are excluded until the thirteenth month in which they have comparable prior year sales. Temporarily closed stores are excluded from the comparable store sales calculation during the month of closure. Location closures in excess of three months are excluded until the thirteenth month post re-opening. Comparable store sales exclude the impact of our e-commerce channel revenues and are calculated on a currency neutral basis using historical quarterly average currency rates.
(2) Reflects quarter-over-quarter and year-over-year change as if the current period results were in “constant currency,” which is a non-GAAP financial measure. Constant currency is a measure utilized by management in which current period results have been restated using prior year average foreign exchange rates for the comparative period to enhance the visibility of the underlying business trends by excluding the impact of foreign currency exchange rate fluctuations. We do not suggest that investors should consider this non-GAAP measure in isolation from, or as a substitute for, financial information prepared in accordance with U.S. GAAP.
Investor Contact:
Brendon Frey, ICR
(203) 682-8200
Brendon.Frey@icrinc.com
Media Contact:
Katy Michael/Crocs Inc.
(303) 848-7000
kmichael@crocs.com
Primary Logo
Crocs, Inc. – See more at: http://investors.crocs.com/phoenix.zhtml?c=193409&p=irol-newsArticle&ID=2166834#sthash.1YJOXYWy.dpuf
About (Nasdaq: CROX)
Crocs, Inc., together with its subsidiaries, designs, develops, manufactures, markets, and distributes casual lifestyle footwear and accessories for men, women, and children worldwide. It offers various footwear products, including clogs, sandals, wedges, flats, sneakers, and boots. The company’s primary trademarks include the Crocs logo and the Crocs word mark. It sells its products in approximately 65 countries through domestic and international retailers and distributors, as well as directly to end-user consumers through company-operated retail stores, outlets, Webstores, and kiosks. As of December 31, 2015, Crocs, Inc. operated 275 retail stores; 98 kiosks and store-in-stores; 186 outlet stores; and 12 company-operated e-commerce Web stores. The company was founded in 1999 and is headquartered in Niwot, Colorado.
Broad street alerts has not been compensated for the mention of any publicly traded companies in this article nor do we own positions in any of the companies in this article.
Source: Crocs imc., Soran Weekly Review, StockCharts.com
DISCLAIMER
Broad Street Alerts is a wholly owned subsidiary of Small Cap Specialists LLC, herein referred to as SCS LLC.
Our reports/releases are a commercial advertisement and are for general information purposes ONLY. We are engaged in the business of marketing and advertising companies for monetary compensation. Never invest in any stock featured on our site or emails unless you can afford to lose your entire investment. The disclaimer is to be read and fully understood before using our services, joining our site or our email/blog list as well as any social networking platforms we may use.
PLEASE NOTE WELL: SCS LLC and its employees are not a Registered Investment Advisor, Broker Dealer or a member of any association for other research providers in any jurisdiction whatsoever.
Release of Liability: Through use of this website viewing or using you agree to hold SCS LLC, its operators owners and employees harmless and to completely release them from any and all liability due to any and all loss (monetary or otherwise), damage (monetary or otherwise), or injury (monetary or otherwise) that you may incur. The information contained herein is based on sources which we believe to be reliable but is not guaranteed by us as being accurate and does not purport to be a complete statement or summary of the available data. SCS LLC encourages readers and investors to supplement the information in these reports with independent research and other professional advice. All information on featured companies is provided by the companies profiled, or is available from public sources and SCS LLC makes no representations, warranties or guarantees as to the accuracy or completeness of the disclosure by the profiled companies. None of the materials or advertisements herein constitute offers or solicitations to purchase or sell securities of the companies profiled herein and any decision to invest in any such company or other financial decisions should not be made based upon the information provide herein. Instead SCS LLC strongly urges you conduct a complete and independent investigation of the respective companies and consideration of all pertinent risks. Readers are advised to review SEC periodic reports: Forms 10-Q, 10K, Form 8-K, insider reports, Forms 3, 4, 5 Schedule 13D. SCS LLC is compliant with the Can Spam Act of 2003. SCS LLC does not offer such advice or analysis, and SCS LLC further urges you to consult your own independent tax, business, financial and investment advisors. Investing in micro-cap and growth securities is highly speculative and carries and extremely high degree of risk. It is possible that an investor’s investment may be lost or impaired due to the speculative nature of the companies profiled.
The Private Securities Litigation Reform Act of 1995 provides investors a ‘safe harbor’ in regard to forward-looking statements. Any statements that express or involve discussions with respect to predictions, expectations, beliefs, plans, projections, objectives, goals, assumptions or future events or performance are not statements of historical fact may be “forward looking statements”. Forward looking statements are based on expectations, estimates, and projections at the time the statements are made that involve a number of risks and uncertainties which could cause actual results or events to differ materially from those presently anticipated. Forward looking statements in this action may be identified through use of words such as “projects”, “foresee”, “expects”, “will”, “anticipates”, “estimates”, “believes”, “understands”, or that by statements indicating certain actions & quote; “may”, “could”, or “might” occur. Understand there is no guarantee past performance will be indicative of future results.
In preparing this publication, SCS LLC has relied upon information supplied by its customers, publicly available information and press releases which it believes to be reliable; however, such reliability cannot be guaranteed. Investors should not rely on the information contained in this website. Rather, investors should use the information contained in this website as a starting point for doing additional independent research on the featured companies. The advertisements in this website are believed to be reliable, however, SCS LLC and its owners, affiliates, subsidiaries, officers, directors, representatives and agents disclaim any liability as to the completeness or accuracy of the information contained in any advertisement and for any omissions of materials facts from such advertisement. SCS LLC is not responsible for any claims made by the companies advertised herein, nor is SCS LLC responsible for any other promotional firm, its program or its structure.
SCS LLC is not affiliated with any exchange, electronic quotation system, the Securities Exchange Commission or FINRA. SCS LLC is not a Broker/Dealer and does not engage in high frequency trading.