See Full Report below….
About Broad Street Alerts:
Big opportunities in Small Cap’s
Broad Street Alerts recent profiles and track record, 217% in verifiable potential gains for our
members on the last 4 small cap alerts alone!
• February 10th, 2016- (NASDAQ: BONT) opened $1.65/share hit a high of $3.00/share within 30 days our members gains- 83%
• March 7th, 2016-(NYSE-MKT: FSI) opened at .91/share and hit 1.10/share within 5 days for gains of 21% for our members.
• March 24th, 2016- (NASDAQ: ICLD) opened at $.77/share it a high of $1.15/share within 2 days for gains of 49% for our members.
April 11th, 2016 – (NASDAQ: FNJN) called at $1.07/share hit $1.76/share in 3 days for 64% gains for our members.
***Get our small cap profiles, special situation and watch alerts in real time. We are now offering our
VIP SMS/text alert service for free, simply text the word “Alerts” to the phone number 25827 from your cell phone.
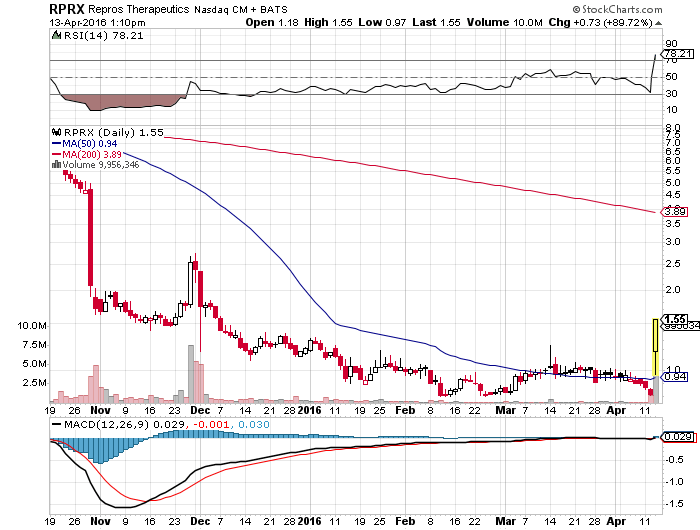
Repros Therapeutics Inc.® (Nasdaq: RPRX)
Repros Therapeutics Inc.® (Nasdaq: RPRX) reported that vaginal administration of Proellex at doses of both 6 and 12 mg achieved significant reduction in excessive menstrual bleeding, the key symptom of uterine fibroids.
Normal menstrual blood loss in a menstrual cycle is approximately 35 mL. Woman experiencing blood loss of >80 mL are considered to suffer from menorrhagia or excessive menstrual bleeding. In this small Phase 2b study, 13, 15 and 14 women with confirmed uterine fibroids were enrolled in the 6mg, 12mg and placebo arms, respectively. At baseline, the mean amount of blood lost for one menstrual cycle was 255 mL, 274 mL and 238 mL for each arm, respectively. The blood loss ranged from a low of 94 mL to a high of 654 mL. The most severe menstrual bleeding at baseline was observed in the 12 mg group. Blood loss was determined by collecting all sanitary products used from an individual and then an alkaline hematin assay was performed to estimate the actual amount of blood collected in the pads.
When a sufficient concentration of Proellex® is achieved in circulation, amenorrhea (cessation of menses) is achieved. Just over half, 52%, of Proellex®-treated subjects became amenorrheic with no evidence of a dose effect. All subjects treated with Placebo continued to menstruate throughout the 18 week dosing period. The p-value for this comparison is 0.0011. Bleeding diaries consistently report a statistically significant difference in the number of days of bleeding and bleeding intensity between those treated with Proellex® and Placebo.
Bleeding was also evaluated by PBAC (Pictorial Blood Assessment Chart). Subjects tallied sanitary product usage and stain size as guided by the chart. Proellex®-treated subjects reported a median 100% reduction in PBAC scores while Placebo-treated subjects reported a 25.4% reduction, further supporting the treatment affect associated with bleeding (p=0.0033).
Along with changes in menstrual patterns, fibroids measured by MRI were reduced in volume in the Proellex®-treated arms by 18% while the Placebo group showed continued increase in size, p= 0.0437.
The drug was generally well tolerated. Women in the drug arms continued to exhibit levels of estradiol consistent with bone preservation.
After the first 18 week treatment period, the women were withdrawn from drug to allow for menses. The women in the study are currently being treated with the second course of treatment for another 18 weeks. The study treatment assignment remains blinded to the subjects, physicians and those managing the study and data. The results of the second course of treatment should be reported within the next 5 months.
The Company believes Proellex® represents a significant advantage over GnRH agonists and antagonists in the treatment of uterine fibroids. Once both the vaginal and oral studies complete both 18 week courses of treatment the Company plans to request an end of Phase 2 meeting with the FDA to jointly discuss plans for Phase 3.
Chart setup

| Composite Indicators | Signal | ||||||||||
| Buy | |||||||||||
| Short Term Indicators | |||||||||||
| Buy | |||||||||||
| Buy | |||||||||||
| Buy | |||||||||||
| Buy | |||||||||||
| Hold | |||||||||||
| Short Term Indicators Average: 80% Buy | |||||||||||
| 20-Day Average Volume – 3,191,843 | |||||||||||
| Medium Term Indicators | |||||||||||
| Buy | |||||||||||
| Buy | |||||||||||
| Buy | |||||||||||
| Buy | |||||||||||
| Medium Term Indicators Average: 100% Buy | |||||||||||
| 50-Day Average Volume – 4,932,809 | |||||||||||
| Long Term Indicators | |||||||||||
| Buy | |||||||||||
| Buy | |||||||||||
| Sell | |||||||||||
| Long Term Indicators Average: 33% Buy | |||||||||||
| 100-Day Average Volume – 4,734,734 | |||||||||||
| Overall Average: 80% Buy | |||||||||||
|
|||||||||||
Sources: Stcokscharts, Streetinsider, barchart
Broad Street Alerts has not been compensated for the mention of any of the securities in this article and we do not hold any positions.